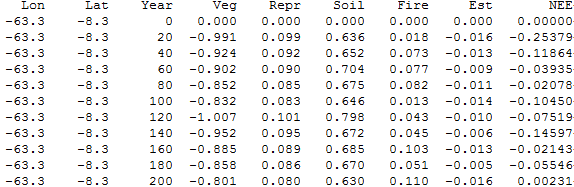
In addition to graphical output to the screen, results from a model simulation are written to output files. These are plain text files in which each row corresponds to an interval of simulation time, and columns contain output for a particular variable. Column labels appear in an initial header row. The first three columns show the longitude and latitude (in degrees) of the simulated location and the output year. An example showing results for ecosystem carbon fluxes is shown below:
|
Output files are normally identified by their ".out" extension (e.g. "cflux.out") and are written to the workspace folder by default. Data may be readily imported into spreadsheet or plotting software for further analysis and visualisation.
By default, results from consecutive simulations overwrite previous results (unless a new file name is specified). The values that appear in the output files are averages for the last five years up to and including the specified simulation year. Output records are written at an interval of 20 simulation years.This default behaviour may be changed by adjusting the output mode, period and interval settings in the instruction file:
| output_mode "overwrite" | If the file exists, output from a new simulation replaces the existing content. | |
| output_mode "append" | If the output file exists, output from a new simulation is added to the end. Remember to scroll down to the end of the file to find results from the most recent simulation. | |
| output_mode "new" | If the file exists, output is written to a new file with a slightly different name. Output file names are reported in the Simulation log window of the LPJ-GUESS Windows Shell at the end of a successful run. | |
| output_interval | Interval in simulation years between records in the output file. | |
| output_period | Averaging period in simulation years for data written to the output file. |